Most of the prominent clichés when discussing California portray the state as the golden land of Hollywood, beaches or a liberal state of vegans and free thinkers. To be fair, California’s campaign to right past wrongs has produced noteworthy successes. For example, marijuana has been legal for years and many people jailed for marijuana offenses have been set free with clean records. However, under its golden exterior, it’s a state mired in contradiction. California has a record of enslavement and racial hierarchy. Worse still, those “great men” of California who denied freedom and equality to others remain exalted as iconic and heroic by California’s official institutions. In this new historical moment, let us champion those who demand a reckoning with slavery, long-overdue and much-needed to redeem this “golden” state still marred by its legacy of enslavement.
California was brought into the United States as a “free” state in 1850 and even though the state’s official stance was anti-slavery, slavery persisted for years for African Americans and Native Americans. What was supposed to be a land full of riches left many destitute, especially the people already living on the land when it was “discovered” by Europeans and early American settlers.
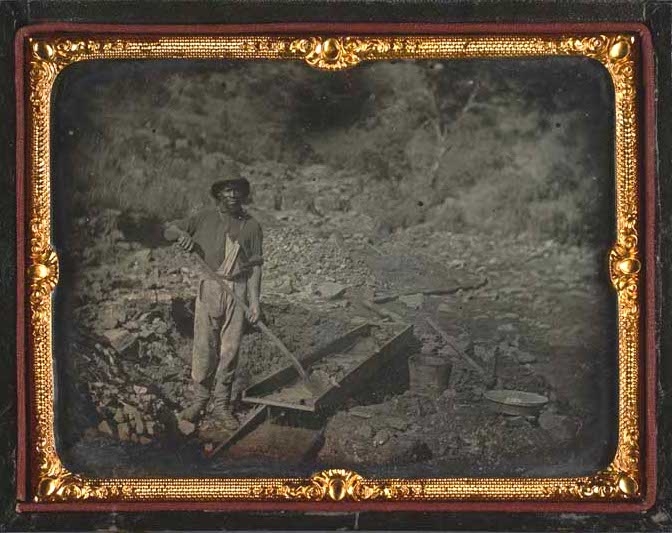
When gold was found in 1849, California was inundated with newcomers hoping to strike it rich. One of these men was white man from Mississippi named Charles Perkins. He arrived in California with his three slaves; Carter Perkins, Robert Perkins and Sandy Jones. After a short time, Charles decided to head back to the South, leaving the slaves in the care of a friend but promising the trio freedom if they worked for a few more months. They were freed November 1951 and swiftly established a successful mining business. Their future looked bright. Even though Charles Perkins did not provide paperwork granting them freedom, men assumed their freedom was guaranteed because California outlawed slavery in 1850. However, California passed a Fugitive Slave Act in 1852 declaring slaves arriving before 1850 were still property of their prior owner. In April 1852, Charles Perkins’ first cousin, Green Perkins broke into the men’s cabin while they were sleeping, tied them up and hauled them in a wagon to Sacramento. The trio hired a lawyer who argued that their detainment was unconstitutional, but no justice was to be found in court. The group eventually escaped while being deported to Mississippi. Many other African Americans would find themselves in the same predicament of fighting for their freedom in the courts. Five years later in 1857, the US Supreme Court, speaking as the supreme authority in America as a whole, declared, “the negro has no rights which the white man is bound to respect, and the negro might justly and lawfully be reduced to slavery for his benefit.”
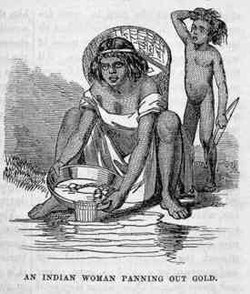
African Americans were not alone in suffering under Californian “freedom.” The indigenous population of California suffered under the Spanish as well as the Americans. Native American slavery in California dates to the early 1800s when Franciscan missionaries established Missions along the Pacific coast. Max Mazzetti from the Rincon Reservation recalled a story he heard about Mission San Luis Rey,
“The Father there had Spaniards working the Indians as slaves there, and when they ran away, the Spaniards would come to Rincon and get the babies, swinging them by the arm or leg and toss them into the cactus…while the babies were crying, the Spaniards would make the parents tell where the Indians were hiding…those who had run away from the mission.”
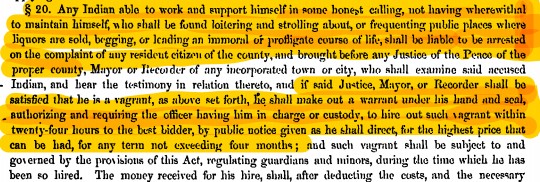
Act for Government and Protection of Indians. Chap 133
California issued this official resolution prior to being granted statehood: “Neither slavery nor involuntary servitude, unless for punishment of crimes, shall ever be tolerated in this State.” It echoes the 13th Amendment to the United States Constitution in 1865. Likewise, just as the 13th Amendment ushered in laws on vagrancy, and other minor offenses at the cost of freedom to African Americans, California passed the Act for Government and Protection of Indians. The act made it legal for white Americans to enslave Native Americans charged with loitering or public drinking. At the same time, it was a common practice for local ranchers and vineyard owners to pay their indigenous workers with wine. Lawmen routinely inspected the ranches to round up intoxicated Native Americans. The natives were later bailed out at auctions and forced to work off the newly incurred debt in a system similar to convict-leasing in the Jim Crow south.
The man who signed the Act for Government and Protection of Indians was Peter Hardeman Burnett, California’s first elected governor when it became a state. While not well known outside of California, he was recently rebuked by current governor, Gavin Newsome for his countless atrocities against Native Americans. Burnett envisioned a western frontier with no Native Americans, or blacks or Chinese. He predicted to the 1851 Legislature, “That a war of extermination will continue to be waged between the races until the Indian race becomes extinct must be expected …” He oversaw the massacre of hundreds of innocent Pomo tribe members in an event known as the Bloody Island Massacre in 1850. Owing in part to his desire to pass a violent exclusionary law against African Americans and to his overall poor leadership, his tenure as governor lasted only one year, but he was still elected to the California Supreme Court in 1857 because racism in America is rarely a deal breaker.
Peter Burnett along with John Sutter helped establish the city of Sacramento. John Sutter is another exalted person in California history whose past is bloodied by the atrocities for which he is responsible. He is well known for establishing Sutter’s Fort, which was a haven for white Americans traveling to the California territory and it was on his land that gold was found ushering in the Gold Rush in 1849. Several state-sanctioned sites to this day sing his praises as a pioneer and a hospitable, charitable gentleman. However, the indigenous community bears witness to Sutter’s crimes against humanity. There are countless accounts of how he mistreated his Native American slaves, kidnapping, rape, and one account of keeping a native woman bound by her nose ring to a post. Even when California became a state, there was a law that forbade Native Americans, African Americans and mulattoes from testifying against white men, dooming them to suffer in silence without legal recourse. For years, there has been an outcry from the Californian Native American community about John Sutter’s mistreatment of his indigenous workers, yet he remains an honored forefather in the California pantheon.
Some progress has been made on reckoning with Sutter’s atrocities. On June 15, 2020, the John Sutter statue was removed from the Sutter Medical Center in Sacramento, California and more removals of his name are on the horizon. It was one of countless statues or monuments removed as the United States began to publicly acknowledge how its past has shaped its present. In this manner, California can be seen as a microcosm of America.
Yet monuments to racist figures remain prominent in California even as others fall. In June 2015, the city of Sacramento erected an 8-foot tall statue of Ronald Reagan. Ronald Reagan became governor of California after his career in Hollywood. During his campaign for governor in 1966, he denounced the Civil Rights Act of 1964 as well as the Voting Rights Act of 1965. He referred to the urban areas where African Americans lived as “jungles.” Recently, a recording of his talking to Richard Nixon reveals his reference to African Americans as “monkeys.” He also supported discriminatory housing policies saying, “If an individual wants to discriminate against Negroes in the sale or renting of his property, it is his right to do so.” Once he decided to run for president, he coined the slogan, “Let’s Make America Great Again” longing for the days before the Civil Rights Act. While president, he attempted to dilute the Voting Rights Act and attempted to abolish affirmative action. His refusal to disavow apartheid in South Africa, led Archbishop and Nobel Peace Prize winner Desmond Tutu to declare he is “a racist, pure and simple.” Despite this, California decided to erect a statue in his honor in the state capitol building. The statue ironically replaced a statue of Christopher Columbus, the forefather of genocide in the Americas.
California has started making strides in decolonizing its history. School names are changing, and monuments are being removed all over the state as indigenous voices are being heard. In his farewell address to the nation, Reagan called America a “shining city on a hill” invoking the voice of writer and pilgrim, John Winthrop discussing America as a beacon for freedom. What Reagan ignored is that Winthrop, author of A Model of Christian Charity owned at least one Native American slave taken during the Pequot War of 1636–37. Perhaps a better farewell-cum-rallying cry that harks back to California history is Shakespeare’s “All that glitters is not gold.” However, the golden state that honors slaveholders and a racist former president as native sons can now pride itself on its native daughter and celebrate our new Black/South-Asian and first female Vice President of the United States of America. Kamala Harris represents California unchained.
Bibliography:
“Involuntary Servitude Apprenticeship and Slavery of Native Americans in California « California Indian History.” n.d. Accessed November 11, 2020. https://calindianhistory.org/involuntary-servitude-apprenticeship-slavery-native-americans-california/.
“Sutter Health Removes John Sutter Statue Amid Complaints About Racist History – Capradio.Org.” n.d. Accessed November 11, 2020. https://www.capradio.org/articles/2020/06/15/sutter-health-removes-john-sutter-statue-amid-complaints-about-racial-history/.
Wee | @ewee, Dogmo Studios | Eliza. 2018. “About – Gold Chains: The Hidden History of Slavery in California | ACLU NorCal.” ACLU of Northern CA. June 28, 2018. https://www.aclunc.org/sites/goldchains/about.html.